

An EV charger load calculation should answer two different questions: how much energy vehicles need before departure and how much instantaneous power the electrical system must supply. Adding every charger nameplate gives a conservative connected load, but it may not describe a managed fleet. Using average daily energy alone creates the opposite risk because several vehicles can arrive together with short dwell time. A defensible model keeps energy, power and concurrency separate.
This guide uses a worked planning method, not a final electrical design. Site voltage, current, diversity, protection, transformer loading, voltage drop and fault duty must be checked by qualified professionals under local requirements. YG charger ratings provide equipment boundaries after the operating scenario has been defined.
After the demand model identifies the required charging power, compare it with the input and output limits of YG commercial car chargers. The separate commercial EV charger installation guide then covers civil work, protection and commissioning.
Which Vehicle Inputs Start The Calculation?
Create one row per vehicle group: vehicle count, usable battery capacity, starting state of charge, required departure state, charging efficiency, arrival, departure and minimum reserve. Required grid energy is the battery energy added divided by assumed charging efficiency.
Use real telematics when available and test seasonal extremes. A fleet that normally returns half full may occasionally return nearly empty, so separate normal planning from a resilience case rather than hiding both inside one arbitrary margin.
Calculate grid energy from the required battery increase and charging efficiency for each vehicle group. Use arrival and departure records rather than one fleet average. Normal, peak and contingency cases should remain separate so decision-makers can see the consequence of each assumption.
Send the vehicle types, battery capacities, dwell times and daily charging demand to establish the operating load.

How Is Energy Converted Into Minimum Charging Power?
Divide required grid energy by available charging hours to estimate average power for each group. For example, ten vehicles each needing 42 kWh from the grid require 420 kWh.
Across an eight-hour window, the theoretical average is 52.5 kW. That does not mean one 60 kW unit can serve the fleet: connector time, vehicle acceptance rate, bay changes, late arrivals and a failed session must be added. The calculation should show which operational assumptions create the proposed charger count.
| Planning input | Example | Project source |
| Vehicles in group | 10 | Fleet schedule |
| Grid energy per vehicle | 42 kWh | Battery need ÷ efficiency |
| Total grid energy | 420 kWh | Calculated |
| Charging window | 8 h | Arrival and departure data |
| Theoretical average | 52.5 kW | Energy ÷ time |
| Charger choices | 60 / 80 / 120 kW | YG published range |
| Managed site limit | Project-specific | Utility and electrical design |
| Contingency | Project-specific | Operations risk review |
Convert energy into required average power using the real charging window, then add connector occupancy, vehicle acceptance limits and operational delays. The arithmetic should show whether the chosen number of bays can complete priority departures, not merely deliver the daily total eventually.
Keep the example separate from the project result. The 52.5 kW figure is an average over the full eight hours, not a feeder design or proof that one connector can serve ten vehicles. If charging time is lost to staggered arrivals or moving vehicles, identify that loss explicitly before comparing cabinet power.
Send vehicle battery data, arrival state of charge, dwell time and departure target. YG can review the load model before charger power is assigned.
How Do Concurrency And Demand Limits Change The Result?
Model a time series or defined operating blocks rather than applying one unexplained diversity factor. Assign priority vehicles, maximum site demand and the number of simultaneous sessions.
Managed charging can allocate power below the sum of charger ratings, but verify how quickly it responds, what happens if communications fail and whether departure targets remain achievable. Compare the managed maximum with measured building demand and utility limits at the same interval used for billing or protection studies.
Test an arrival cluster against the departure order instead of spreading demand evenly by assumption. If the site limit is binding, show which vehicle receives power first and which completion time changes. This makes the consequence of a demand limit visible to operations before an equipment count is accepted.
Provide transformer, feeder and demand-limit information so available site power can be reviewed against the charging schedule.

Which Charger Ratings Enter The Equipment Check?
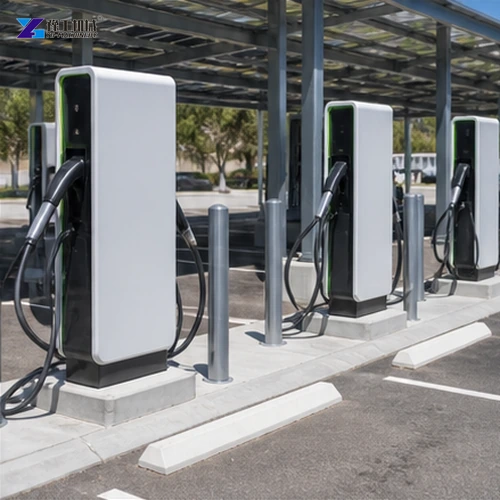
YG offers 60, 80 and 120 kW rated configurations with AC380V input and 200–750 VDC output. Maximum single-gun current is published as 112, 150 and 160 A.
Vehicle voltage and current acceptance can limit delivered power below the cabinet rating, especially as battery temperature and state of charge change. Use the table to screen hardware after the fleet model, then confirm connector, protocol and simultaneous-output behavior in the proposal.
Do not replace the vehicle charging curve with cabinet rating throughout the session. The model should retain the vehicle-side acceptance assumptions and flag any unconfirmed sharing between outlets. That distinction is particularly important when a short dwell window is being used to justify more rated power.
What Electrical Checks Follow The Operating Model?
Convert the approved maximum charging demand into feeder current with the actual supply, phase arrangement, efficiency and power factor, then add existing site demand using the applicable method. Check service and transformer capacity, cable ampacity, voltage drop, protective coordination, fault level, earthing, harmonics and metering.
Do not use the charger DC output current as the AC feeder current. Document the calculation version and keep manufacturer data with the electrical design.
After the operating model is accepted, qualified professionals check transformer and service capacity, feeder current, voltage drop, fault level, protection, earthing and harmonics. Commissioning data should then be compared with the model and used to update future expansion decisions.
Share the calculated concurrent load and preferred charging time to compare suitable charger ratings.
How Should The Model Be Tested Before Expansion?
Commission a limited group and compare session energy, peak demand, queueing and departure readiness with the assumptions. Review low-temperature days, high-utilization shifts and charger outages.
If vehicles wait while spare site capacity exists, scheduling or power allocation may need adjustment. If demand exceeds the limit, correct the control or operating plan before adding chargers. A monitored pilot turns the spreadsheet into evidence for the next stage.
Run sensitivity checks for colder weather, late arrivals, a charger outage and higher building demand. The model should show missed departures as well as electrical demand so tradeoffs remain visible.
Present results as scenarios instead of one unexplained total. A normal day, high-demand day and contingency case can show required energy, maximum managed demand, vehicles completed and missed departures. Decision-makers can then see the consequence of a lower site limit or failed charger. Preserve formulas, data sources and timestamps so the model can be updated when routes, batteries or tariffs change. The best calculation is not the one with the largest margin; it is the one whose assumptions can be tested against session records.
Keep calculation inputs, formulas, utility constraints, charger data and commissioning measurements under revision control. Update the model before fleet, route or tariff changes become permanent.
Recheck the model whenever fleet arrival patterns, route energy or the building operating schedule changes materially.
Provide the site demand limit, concurrency assumptions and expansion plan when you need the charger mix checked against both fleet service and electrical capacity.
Submit the present load model and future vehicle plan so YG can review a staged equipment configuration.

Ev Charger Load Calculation Buyer Questions
No. Connected load is the sum of ratings; maximum demand depends on control and simultaneous use.
Battery voltage, current acceptance, temperature and state of charge can limit power.
Not alone; feeder design must consider instantaneous demand and electrical requirements.
Use transparent scenarios and approved design allowances rather than an unexplained percentage.
Send the scenario inputs and identify the result that governs the purchase: departure readiness, maximum demand or resilience during an outage. YG can compare charger hardware once those constraints are explicit. The example arithmetic remains a planning illustration, while the site electrical design requires its own qualified review.